# 坐标轴旋转
ggdotchart(df5, x = "name", y = "mpg", group = "cyl", color = "cyl", palette = c('#999999','#E69F00','#56B4E9'), rotate = TRUE, sorting = "descending", ggtheme = theme_bw(), y.text.col = TRUE )

#设置点的大小:
ggdotchart(df5, x = "name", y = "mpg", group = "cyl", color = "cyl", size = "cyl", palette = c('#999999','#E69F00','#56B4E9'), rotate = TRUE, sorting = "descending", ggtheme = theme_bw(), y.text.col = TRUE )

# 统一设定点大小,添加虚线网格
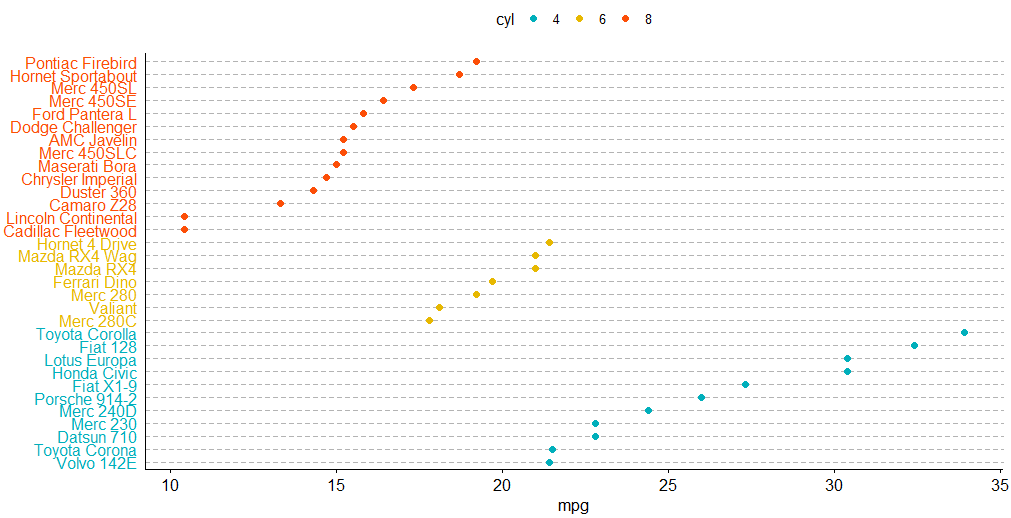
ggdotchart(df5, x = "name", y = "mpg", group = "cyl", color = "cyl", palette = c("#00AFBB", "#E7B800", "#FC4E07"), sorting = "descending", rotate = TRUE, dot.size = 2, y.text.col = TRUE, # Color y text by groups ggtheme = theme_pubr() # ggplot2 theme )+ theme_cleveland() # 添加虚线网格

# 添加标签
ggdotchart(df5, x = "name", y = "mpg", size="cyl", group = "cyl", color = "cyl", label = "name", font.label = list(size=10,color="red",face="bold"), # bold表示粗体字 palette = c('#999999','#E69F00','#56B4E9'), rotate = TRUE, sorting = "descending", ggtheme = theme_bw(), y.text.col = TRUE )

# 添加标签边框,避免重叠
ggdotchart(df5, x = "name", y = "mpg", size="cyl", repel = T, group = "cyl", color = "cyl", label = "name", label.rectangle = T, font.label = list(size=10,color="red",face="bold"), palette = c('#999999','#E69F00','#56B4E9'), rotate = TRUE, sorting = "descending", ggtheme = theme_bw(), y.text.col = TRUE )


